Activity 1.1 - Nitrogen System Indicators
This activity brings together a range of different approaches to indicate the status of the the nitrogen cycle from local to regional scales. It complements the development of indicators of the nitrogen system – i.e. those that look at all the different component nitrogen fluxes and levels to analyze the system – and those that address specific effects. This latter group includes both effects related to benefits of nitrogen use (e.g. food, feed and energy production) as well as those related to adverse effects (e.g. water pollution, air pollution, greenhouse gas emissions, loss of biodiversity and soils).
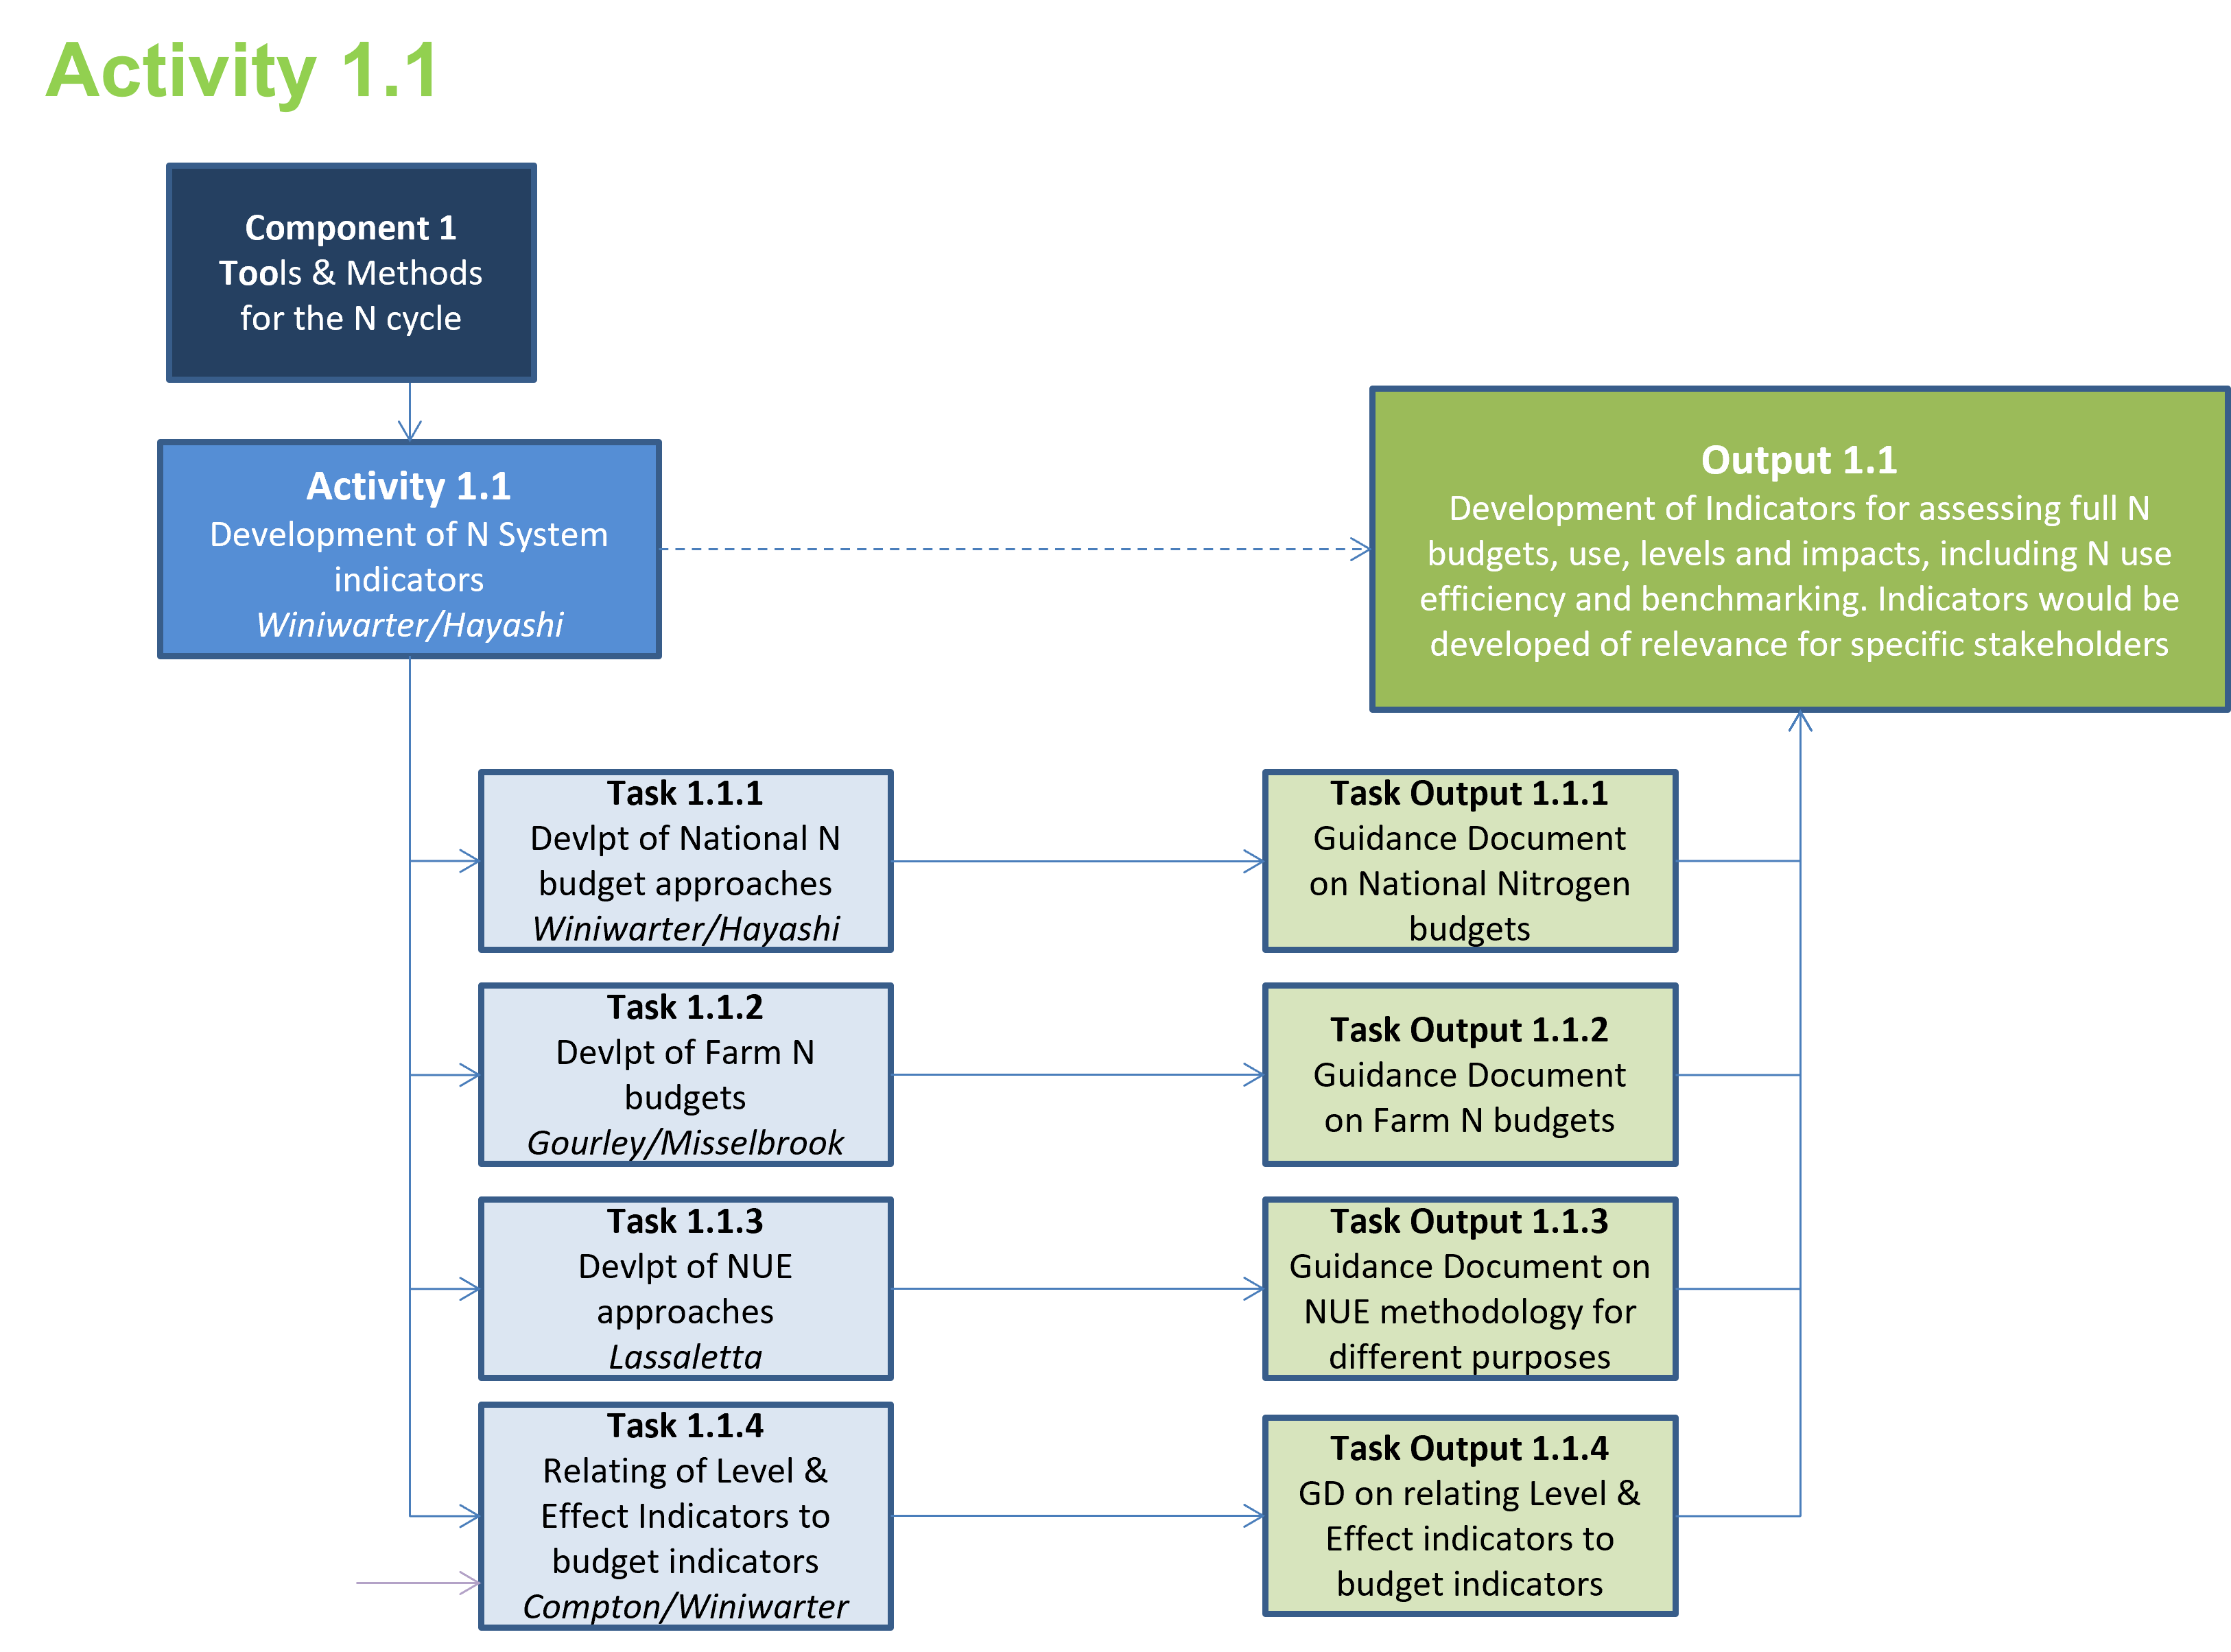
Task 1.1.1 and 1.1.2 focus on developing the component of nitrogen budgets, including harmonization of system definitions and required data sources at national and farm scales. This reflects on the different sector levels – with Task 1.1.1 covering all economic sectors.
Task 1.1.3 focuses on the ways to interpret such nitrogen budgeting approaches. Specifically the use of Nitrogen Use Efficiency, representing N outputs in useful products divided by N inputs is one way to look at these systems, while N balance is another way, in this case looking at N inputs minus N outputs in products. A key challenge here is to define system boundaries in a way to allow meaningful conclusions from the indicators and obtain robust results from potentially diverse input information.
In the Task 1.1.4 efforts are then placed to show how the different N system indicators relate to the different effect based indicators. For example, exploring how reductions in N surplus and improvements in NUE link to reduction in adverse environmental effects and can simultaneously contribute to improving food and energy production.
This activity is leading to several reports on methodologies for nitrogen system indicators, for adoption by partners during plenary meetings of INMS. In addition, the key products and their synthesis are providing important material to support the global assessment process (Activity 2.3).
Activity 1.1 is being delivered under Component 1. The diagram below shows the tasks and task outputs deliviered for this activity. The tasks run in parallele with one another.